March 6, 2026: You Can’t Time the Market, Even During a War
Conflict in the Middle East escalated recently when there was a U.S.-Israeli strike on Iran.
Here is a quick overview of several key metrics since the war broke out.
Oil prices have increased nearly 20% and are now over $80/barrel
Treasury yields have spiked with the 10-year is at ~4.15% and the 30-year at 4.75%. When bond yields increase, bond prices decrease.
The S&P 500 index is down ~1%
The dollar is up ~2%. The US dollar is often seen as a “safe-haven”, which causes large institutions to purchase more dollars when uncertainty spikes.
Various international stock indices are down ~2% to ~4%
Gold is down ~2%
You may be tempted to sell at this time due to heightened uncertainty, but the track record of the average investor is not on your side. Timing the market is incredibly difficult, if not impossible. And what happens if you get it wrong? See this chart*.
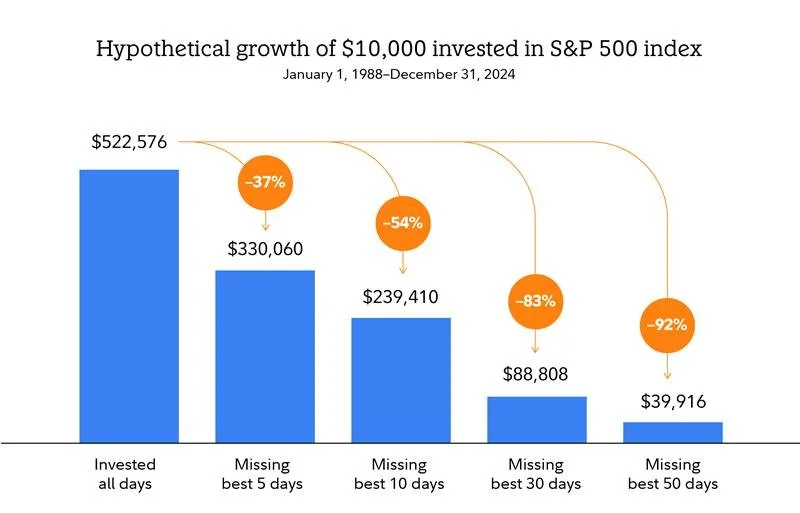
Staying invested has the best long-term outcomes historically. Miss just 5 of the best days of the market and returns are slashed by over a third. Miss the 10 best days of the market and performance is cut in half. Miss the best 30 days and returns are diminished by over 80%. Miss the 50 best days and returns shrink to just a fraction compared to staying invested.
This chart is from the end of 2024 going back to 1988. Just missing 5 days in 36 years can crush your returns!
Timing the market may seem prudent (“I’ll wait for things to cool off. Let the dust settle. Things need to calm down. Then I’ll invest.”), but it is foolish. Timing the market is gambling and can absolutely wreck investment returns, as evidenced by the chart above.
Investment performance isn’t just numbers on a screen. Poor investment performance can force you to work longer until retirement, save more to maintain your lifestyle, and take more risk in your investments to get the required return.
No one can predict the future. Maybe you’ll get lucky and time it right, but the cost of getting it wrong is too great to risk it.
*Past performance is no guarantee of future results. Source: Fidelity, Bloomberg as of 12/31/24. This is based on the cumulative percentage return of a hypothetical investment made in the noted index during periods of economic expansions and recessions. Index returns include reinvestment of capital gains and dividends, if any, but do not reflect the impact of taxes, fees, or expenses, which would lower these figures. This return information is not intended to imply any future performance of the investment product. "Best days" were determined by ranking the one-day total returns for the S&P 500® Index within this time period and ranking them from highest to lowest. There is volatility in the market and a sale at any point in time could result in a gain or loss. See disclosures for index definitions. Your own investment experience will differ, including the possibility of losing money. It is not possible to invest directly in an index. All indexes are unmanaged. Source: Bloomberg, S&P 500 Index® total return for 12/31/49 to 12/31/24; recession and expansion dates defined by the National Bureau of Economic Research (NBER). The S&P 500 Index was created in 1957; however, returns have been reported since 1926, and the index has been reconstructed for years prior to 1957.